Social Impact Surveys
Multiple SIA Projects (Africa)
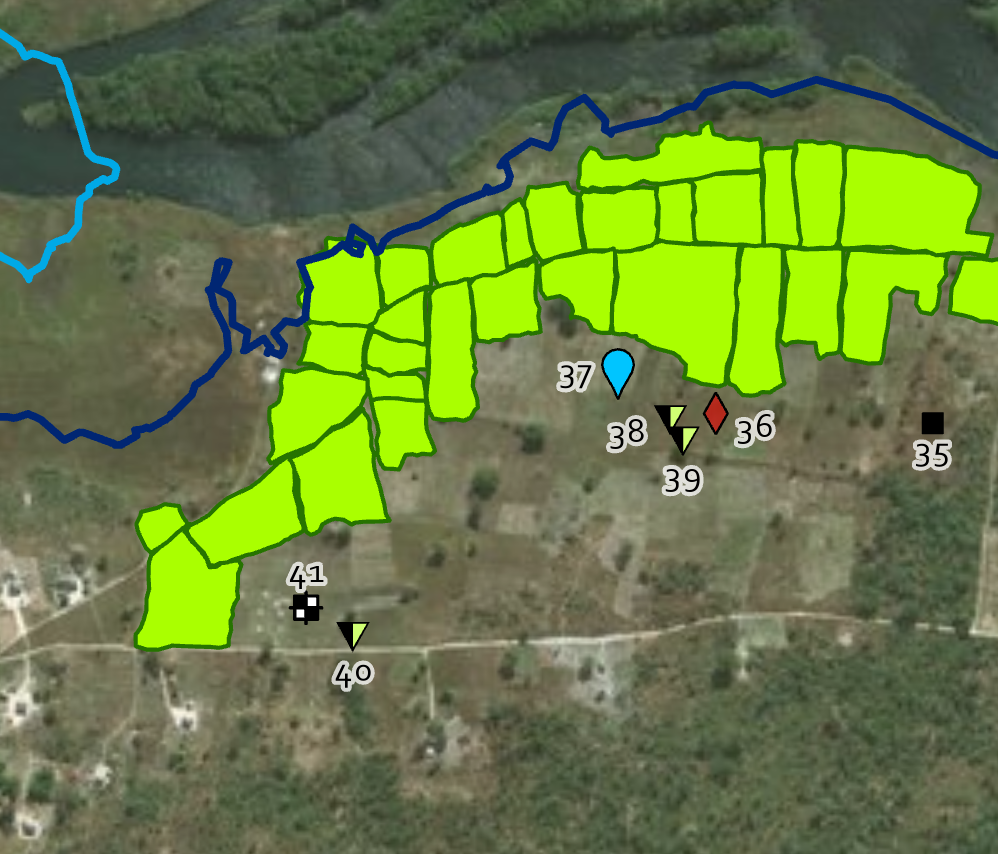
Social Impact Assessment (SIA) survey forms are designed enable SIA teams to interview stakeholders and household members and gather answers to a number of pre-set questions.
The SIA team collects household and member information, such as access to health, education, income etc. The team also collects asset inventory, such as point locations of fruit trees, delineation of fields, orchards and ponds.
The form enables the team to take multiple photos that are associated with the interviewees answer sheet as well as collect GPS point or boundary locations. At the end of the interview and optional report can be generated and the interviewee asked to sign.

Environmental Impact Mapping
Multiple EIA Projects (Africa)
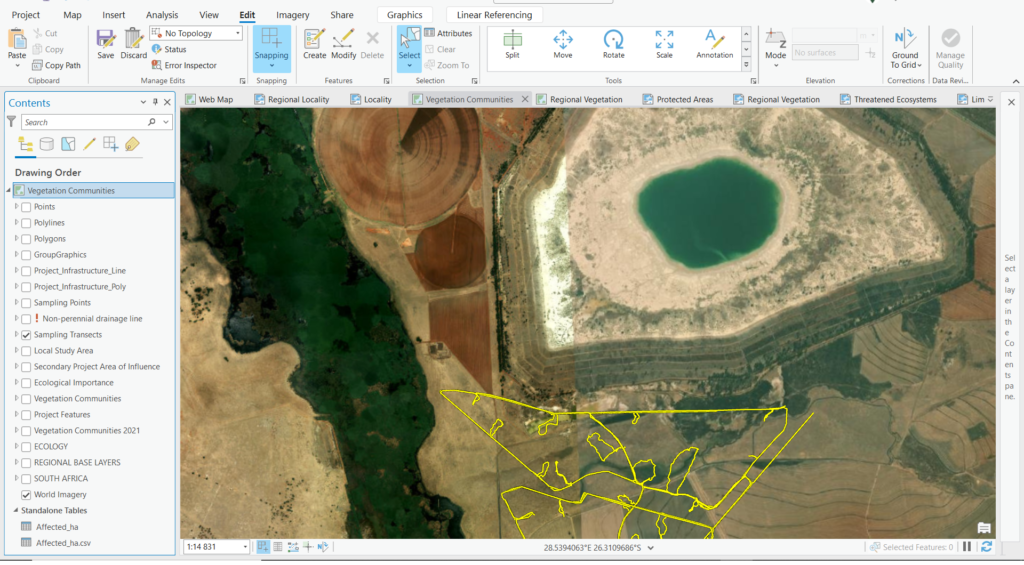
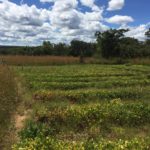
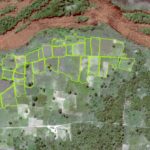
As a leading provider of environmental impact assessment (EIA) support services, we are well-equipped to handle all aspects of your EIA. Our mapping solutions and data collection tools will enable you to submit a complete and accurate maps to accompany your submission.
We have a team of GIS mapping experts who can help you map all the inputs required by your regulators when submitting an EIA. From Surface and Ground water information, to mapping ecological transects from fauna and flora surveys. We can also overlay protected areas, points of interest and various significant country-level and global-level geospatial datasets.
We’ll produce physical maps (Size A4 – A0) and multiple page mapbooks for submitting. And if you need Mobile Maps we’ll enable you to go on site and be able to see the newly proposed infrastructure, take photos and record any information along with a GPS point.
Mapbook Production
Railway Alignment (Zambia)

Development corridors for rail and powerline alignments are often hundreds of kilometers long, making it impractical to display them on a single map. This necessitates the construction of a well-indexed multiple-page mapbook that allows clients to report on findings from their specialist teams in a detailed and logical manner whilst still having access to examine the entire alignment.
Specialist teams use mapbooks to indicate points of significance along the entire route without losing the detail and spatial context required.
Performance Dashboard
Mining Concessions (Mpumalanga, South Africa)

With the map-driven reporting tool you can see how your mining concessions are performing in terms of tonnages extracted. You can also view this data broken down by quarter and month, as well as having the ability to slice and dice the information through the interactive map that updates the metrics in real-time as you pan and zoom on the map.
This provides our users with the ability to have views they were not able to previously generate without having the map-linked functionality. By having spatially relevant reporting you now have access to see spatial correlations and distributions that are not otherwise apparent in static reports.
Ocean Vessel Monitoring
Western Cape

Geographic Information System (GIS) data is used for many purposes including management of marine resources. We have been using GIS technology to monitor the movements of vehicles at sea and in combination with our data models, clients have found this a useful tool in managing their operations sustainably.
GPS boat locations (using vessel VMS) are ingested into the GIS system and are further enhanced using geospatial models to enrich them with non-spatial data and axillary information. The data is transformed, cleaned, and calculations are run to produce information that is relevant to the business before finally published into a map.
A map-enabled dashboard improves the ability of the concession management team to better manage their resources and remain compliant with permit conditions. The data is presented in figures, graphs, tables and charts (and of course a map) and as the user zooms in on the map or filters the selection all the metrics and calculations update to reflect their selection in real-time.
Hydro-power Site Selection
GeoSpatial Modelling (Africa)
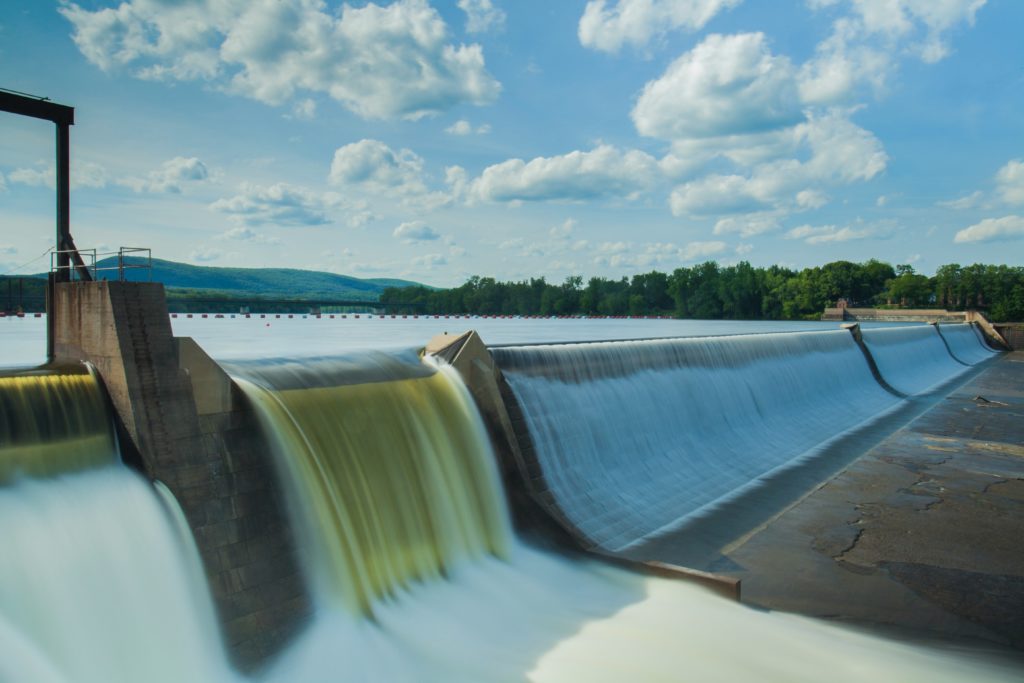
Site location analysis is an important component of any hydro-power project. It is the ranking process by which stretches of river and adjacent lands are ranked against each other to result in a handful of the very best site options to take forward for further investigation.
At GeoGoose, we use advanced geospatial models to drive the site selection process using moving window analysis. We analyse aspects of topology, geology, water flow and catchment to interrogate each stretch of river for its suitability as a potential site.
We have used this method for projects in over 10 countries in Africa producing highly rated results some of which have already commenced construction. Our process to calculate multiple river metrics and integrate client logic to determine their most preferential conditions have enhanced the robustness of their site selection process and provides a defendable mechanism to take forward to the business.
The results are loaded into online maps for easy access during presentations and discussions and mobile apps further enhance the ability of field teams to perform on-site analysis, make geo-located notes and capture photos.